Note
Plastics
Design
The plastics sub-module is a multi-regional dynamic Material Flow Analysis (MFA) of polymers. It is built as a succession of processes connected by flows of polymers, either fresh, embedded in products, or mixed in wastes. What happens in each process to each flow is driven by exogenous parameters such as product lifetimes and waste collection rates set by the user to construct a scenario. The figure below presents a simplified view of this model design.
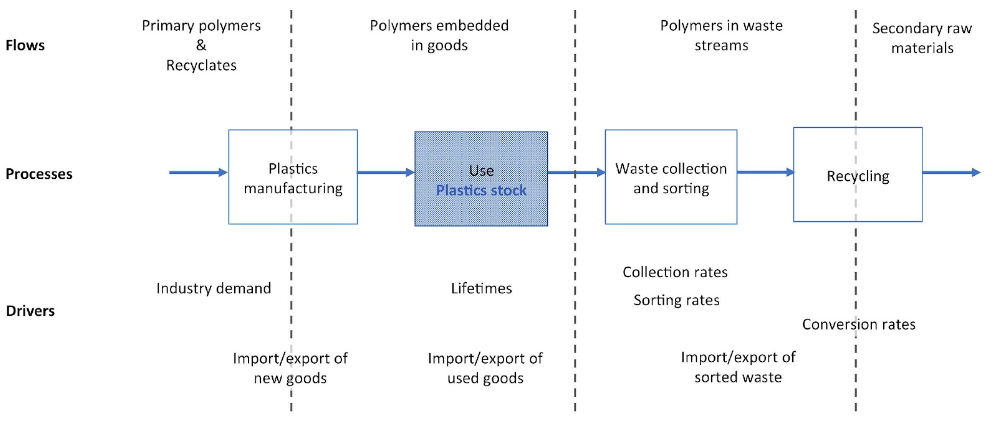
Simplified diagram for the plastics sub-module
In reality, the model includes a larger number of processes and flows, represented in the following flow diagram (see Figure below). The code implements this design using flodym, an adaptation of the ODYM framework. Some general-level explanation are in order:
If a flow or parameter is indexed with e.g. (r,t,c,s,p,e) it means that the model expects values for this flow or parameter for each combination of regions (r), years (t), age cohorts (c), use sectors (s), polymers (p), and elements (e). Index combinations for which input data is not provided receive zero as default value or in some cases may be filled out through interpolation.
The term "polymers" in the diagram refers to polymers that have not yet been actually processed into finished products. The term "plastics" refers to goods containing plastics such as packaging, cars, etc. The model does not quantify, for example, how many cars are produced, but how many tonnes of plastics, differentiated by type of polymer, are contained in the cars produced.
The index (e) allows us to track individual elements in the plastic product flows. In addition to the total mass of plastic product flows (e = All), the carbon content (e = C) and the contamination of a polymer flow by nitrogen from biopolymers (e = N), for example, could be quantified and tracked. Note that this possibility does exist but is not currently used.
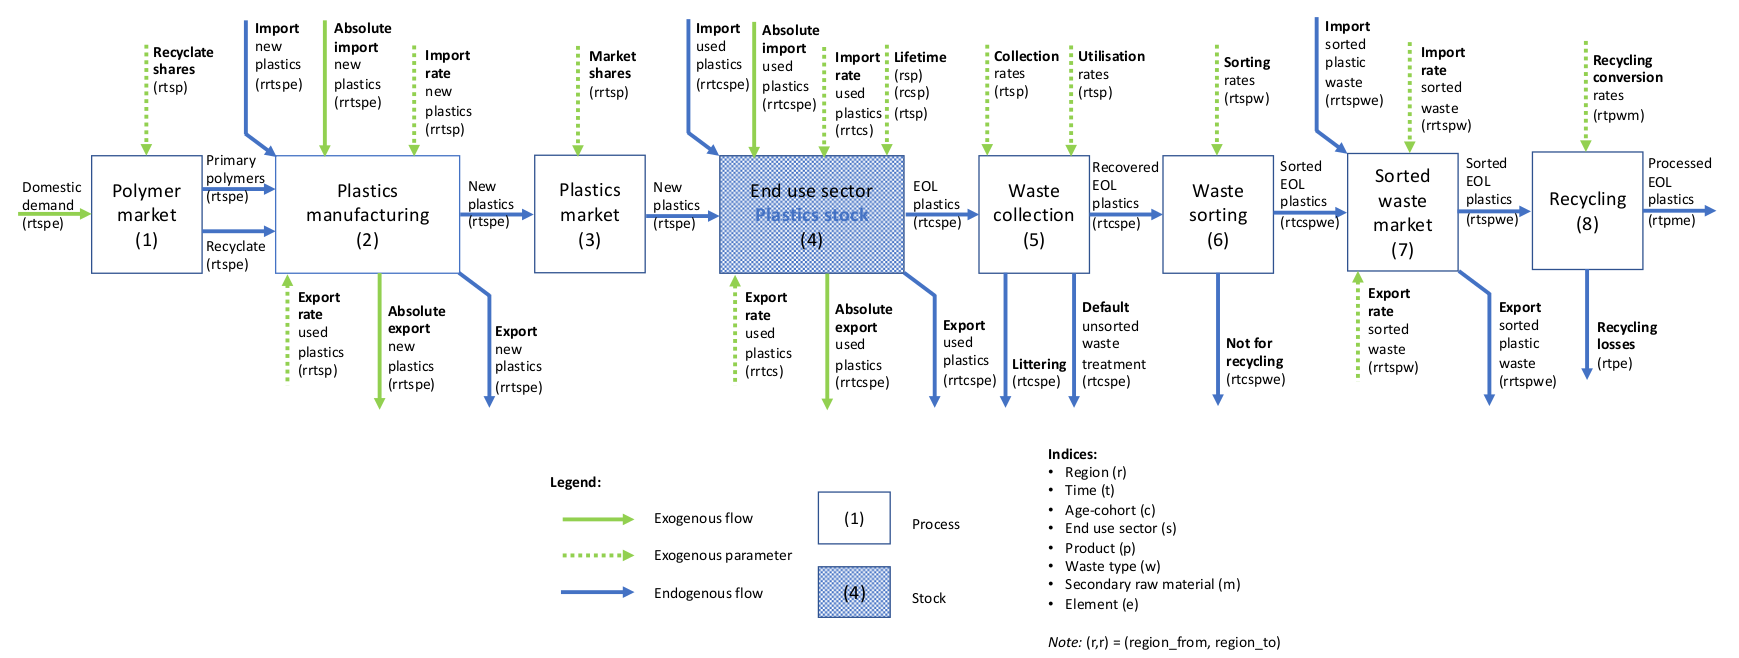
Full diagram for the plastics sub-module
Indices
The following table presents the dimensions indexing the parameters and variables (stock and flows) of the MFA model for plastics.
Dimension |
Index |
Description |
|---|---|---|
time |
t |
Temporal resolution, e.g. yearly values from 1950 to 2050 |
element |
e |
‘All’ covers the mass of the plastic products, further individual elements can be defined |
region |
r |
Geographical resolution, e.g. EU member states |
age cohort |
c |
Age cohort of application sectors |
use sector |
s |
Broad application sectors |
polymers |
p |
Polymers considered (e.g. PE, PP, PS, PS-E, PVC, PET etc.) |
plastic waste |
w |
Destination of plastic waste after collection andsorting (recycling, incineration, landfill) |
plastic secondary raw material |
m |
Secondary raw materials from plastics, e.g. granulates from mechanical recycling |
Parameters
The following table presents the data structure and signification of all input parameters expected by the MFA model for plastics.
parameter |
index |
description |
|---|---|---|
DomesticDemand |
rtspe |
Domestic demand in region r in year t for polymer p by the processing industries producing for use sector s |
RecyclateShare |
rtsp |
Share of recyclates (granulates from mechanical recycling) in year t in region r in demand for new polymer p by the processing industries producing for use sector s |
ImportNew |
r1r2tspe |
Absolute import from region r1 to region r2 in year t of polymer p embedded as plastics in new goods destined to use sector s |
ExportNew |
r1r2tspe |
Absolute export from region r1 to region r2 in year t of polymer p embedded as plastics in new goods destined to use sector s |
ImportRateNew |
r1r2tsp |
Import rate (applied to DomesticDemand) from region r1 to region r2 in year t of polymer p embedded as plastics in new goods destined to use sector s |
ExportRateNew |
r1r2tsp |
Export rate (applied to DomesticDemand) from region r1 to region r2 in year t of polymer p embedded as plastics in new goods destined to use sector s |
MarketShare |
r1r2tsp |
Market share of region r2 in region r1’s new plastics final demand (DomesticDemand + net import) for polymer p embedded as plastics in new goods destined to use sector s in year t |
ImportUsed |
r1r2tcspe |
Absolute import from region r1 to region r2 in year t of polymer p embedded as plastics in used goods belonging to age-cohort c and use sector s |
ExportUsed |
r1r2tcspe |
Absolute export from region r1 to region r2 in year t of polymer p embedded as plastics in used goods belonging to age-cohort c destined to use sector s |
ImportRateUsed |
r1r2tcsp |
Import rate (applied to new plastics final demand, i.e. DomesticDemand + net import) from region r1 to region r2 in year t of polymer p embedded as plastics in used goods belonging to age-cohort c and use sector s |
ExportRateUsed |
r1r2tcsp |
Export rate (applied to stock of age-cohort c) from region r1 to region r2 in year t of polymer p embedded as plastics in used goods belonging to age-cohort c and use sector s |
Lifetime |
rsp |
Lifetime of polymer p embedded in goods in use sector s in region r |
Lifetime_c |
rcsp |
Lifetime of polymer p embedded in goods belonging to age-cohort c and use sector s in region r |
Lifetime_t |
rtsp |
Lifetime of polymer p in use sector s in region r in year t (valid for all age-cohorts) |
EoLCollectionRate |
rtsp |
Collection rate in year t of polymer p embedded in end-of-life (EoL) goods from use sector s |
EoLUtilisationRate |
rtsp |
Utilisation rate in year t of polymer p embedded in collected end-of-life (EoL) goods from use sector s |
SortingRate |
rtspw |
Sorting rate of polymer p embedded in utilised end-of-life (EoL) goods from use sector s to waste category w in year t |
ImportRateSortedWaste |
r1rt2spw |
Import rate (applied to domestically sorted waste flow) from region r1 to region r2 in year t of sorted plastic waste of category w coming from use sector s in year t |
ExportRateSortedWaste |
r1r2tspw |
Export rate (applied to domestic + import sorted waste flow) from region r1 to region r2 in year t of sorted plastic waste of category w coming from use sector s in year t |
RecyclingConversionRate |
rtpwm |
Conversion rate (i.e. 1 – loss rate) in region r of polymer p found in sorted waste category w to secondary raw material m in year t |
Variables
variable |
index |
description |
|---|---|---|
… |
… |
… |
Processes
The following presents the equations governing each of the processes in Full diagram for the plastics sub-module. For each process we provide a short description in plain English, an explanation of the exogenous parameters and model variables, and an algebraic formulation of the equations governing the process. For the parameters and variables we can use both common names as in the diagram and code names as in the algebraic formulation.
Note
Process (1) “Polymer market”
Short description
Demand for polymers from the domestic processing industries is satisfied with either “fresh” polymers (from primary raw materials or from chemical recycling) or recyclates (secondary polymers or granulates from mechanical recycling).
Exogenous parameters
The main exogenous driver for the model is the exogenous flow Domestic demand for polymers (P1_DomesticDemand). The model expects demand by region, sector, and polymer in million tons. Ideally statistical data could be used for historical demand and extrapolated into the future based on scenario assumptions. In our case, however, we rely on converting economic data (GVA of sectors) into demand for polymers in unit of mass before feeding this data into the model. For that purpose, we use a multi-variable regression function calculated outside the model in Excel. The parameter Recyclate shares (P1_RecyclateShare) exogenously sets the ratio between “fresh” polymers and recyclates in satisfying polymer demand.
Model variables
The flow Primary polymers (F_1_2_Primary) is the fraction of Domestic demand for polymers (P1_DomesticDemand) satisfied with “fresh” polymers while the Recyclates (F_1_2_Recyclate) flow is the fraction satisfied with granulates of secondary material from mechanical recycling.
Algebraic formulation
F_1_2_Recyclate = P1_DomesticDemand * P1_RecyclateShare
F_1_2_Primary = P1_DomesticDemand – F_1_2_Recyclate
Process (2) “Plastics manufacturing”
Short description
Polymers (fresh or recyclates) are formed into either stand-alone plastic products (e.g. packaging) or plastic parts for other products (e.g. car parts). Plastics goods or goods containing plastics are also imported and exported.
Exogenous parameters
The exogenous flows Absolute import new plastics (P2_ImportNew) and Absolute export new plastics (P2_ExportNew) allow for absolute import and export of new products containing plastics. The parameters Import rate new plastics (P2_ImportRateNew) and Export rate new plastics (P2_ExportRateNew) also allow for import and export of new products containing plastics, calculated as a rate applied to Domestic demand for polymers (P1_DomesticDemand).
Model variables
The endogenous flows Import new plastics (F_0_2_ImportNew) and Export new plastics (F_2_0_ExportNew) represent total import and export, respectively, calculated as the sum of the absolute flows provided exogenously and the import and export calculated using exogenously provided rates. The variable New plastics (F_2_3_NewPlastics) is the net result of the mass balance between the flows Primary polymers (F_1_2_Primary), Recyclates (F_1_2_Recyclate), Import new plastics (F_0_2_ImportNew), and Export new plastics (F_2_0_ExportNew).
Algebraic formulation
# Internal variable for input flow to process 2
InputManufacturing_1_2 = F_1_2_Primary + F_1_2_Recyclate
# Import and export
F_0_2_ImportNew = P2_Plastics_ImportNew +
(InputManufacturing_1_2 * P2_ImportRateNew)
F_2_0_ExportNew = P2_Plastics_ExportNew + (InputManufacturing_1_2 * P2_ExportRateNew)
# Sum over all import and export regions to calculate net imports, saved in internal variable
ImportNew_0_2 = sum[ F_0_2_ImportNew[rr,r] for rr in regions ]
ExportNew_2_0 = sum[ F_2_0_ExportNew[r,rr] for rr in regions ]
NetImportNew_0_2 = ImportNew_0_2 – ExportNew_2_0
# Mass balance equation
F_2_3_NewPlastics = F_1_2_Primary + F_1_2_Recyclate + NetImportNew_0_2
Process (3) “Plastics market”
Short description
This process allows the user to run the model at a different geographical resolution for the demand side (processes 1 and 2) and stock and waste generation side (processes 4 to 8). For example the demand and import/export of polymers and plastic products could be provided at the EU level while the stocks and recycling potentials from plastic waste generation could be obtained at the EU member level, all in the same model run.
Exogenous parameters
The parameter Market share (P3_MarketShare) defines the share of a (smaller) region in a (larger) region’s new plastics final demand (F_2_3_NewPlastics).
Model variables
The variable New plastics (F_3_4_NewPlastics) is the New plastics (F_2_3_NewPlastics) of the previous process distributed to more regions according to their market shares.
Algebraic formulation
F_3_4_NewPlastics = F_2_3_NewPlastics * P3_MarketShare
Process (4) “End use sectors”
Short description
Plastic containing products of each considered age cohort reside in the stocks associated with end use sectors until they leave the stock, that is until they reach the end of their technical lifetime or are exported as used goods. New products enter the stock every year, while end-of-life products leave it as waste. Some used goods (from an older age-cohorts) can be imported and exported too, that is enter or leave the stock, in the latter case not as waste. The calculations involved in this process are quite convoluted and entail many more steps than for other processes. The algebraic formulation below attempts to provide an overview of those steps.
Exogenous parameters
…
Model variables
…
Algebraic formulation
…
Process (5) “Waste collection”
Short description
The EOL plastics flow exiting the stock (see previous section) goes through two processing steps in process 5:
Collection: some share of this flow is collected while the rest exits the system as littering or dissipative losses.
Utilisation: of this collected EOL plastics another share is sent to further sorting while the remainder goes through whatever is the domestic default waste unsorted treatment. For example, in Germany the former flow sent to sorting would cover the “gelbe Tonne”, “Pfandsystem”, shredder light fraction, and demolition waste, while the latter would be the “schwarze Tonne” sent to the municipal waste incinerator with energy recovery (in other country the default treatment may be incineration without energy recovery or landfill, or a combination of different routes).
Exogenous parameters
The parameter Collection rates (P5_EoLCollectionRate) describes which share of the flow EOL plastics (F_4_5_EOLPlastics) is collected. The parameter Utilisation rates (P5_EoLUtilisationRate) describes which share of the collected waste is sent to further sorting.
Model variables
The flow Recovered EOL plastics (F_5_6_RecoveredEOL) represents the share of the flow EOL plastics (F_4_5_EOLPlastics) that is collected and sent to further sorting. The flow Littering (F_5_0_Littering) is not collected in the first place and irremediably lost. The flow Default unsorted waste treatment (F_5_0_DefaultTreatment) is the share of collected waste not sent to further sorting.
Algebraic formulation
# “Collection”
Collected_F_4_5 = F_4_5_EOLPlastics * P5_EoLCollectionRate
# “Utilisation”
Utilised_F_4_5 = Collected_F_4_5 * P5_EoLUtilisationRate
# Mass balance equation
F_5_6_RecoveredEOL = Utilised_F_4_5
F_5_0_Littering = F_4_5_EOLPlastics – Collected_F_4_5
F_5_0_DefaultTreatment = Collected_F_4_5 – Utilised_F_4_5
Process (6) “Waste sorting”
Short description
Recovered EOL plastics (F_5_6_RecoveredEOL) is domestically sorted into waste fractions defined by the user depending on the expected EOL material’s quality. The user can define as many waste categories as she wants (data availability is often the limiting factor). The model differentiates between categories destined to further recycling (mechanical or chemical) from those categories that will not be recycled (could be incinerated with or without energy recovery or landfilled). For example, a share of packaging waste may be sorted in such a way that it is suitable for mechanical recycling, while another share ends up as refuse derived fuel, which is “not for recycling”.
Exogenous parameters
The parameter Sorting rates (P6_SortingRates) describes the shares of collected waste flowing to waste categories defined by the user. Some of these waste categories are not suitable for recycling and those should be listed in the config file in the section “Model flow control” under the item “Waste_Types_Not_For Recycling”.
Model variables
The output flow Sorted EOL plastics (F_6_7_SortedEOL) represents how much of each polymer from each sector ends up in each of those waste categories belonging to the “recycling fraction”. The Not for recycling (F_6_0_NotForRecycling) flow shows how much of each polymer from each sector ends up in those waste categories that cannot be mechanically or chemically recycled.
Algebraic formulation
# All sorted waste
SortedWaste = F_5_6_RecoveredEOL * P6_SortingRates
# Splitting sorted waste in “for recycling” and “not for recycling”
for w in waste categories:
if w in Waste_Types_Not_For Recycling (defined in config):
F_6_7_SortedEOL[w] = 0
F_6_0_NotForRecycling[w] = SortedWaste[w]
else:
F_6_7_SortedEOL[w] = SortedWaste[w] F_6_0_NotForRecycling[w] = 0
Process (7) “Sorted waste market”
Short description
A region with a mechanical recycling industry may import suitable sorted waste, which in turn is exported from another region. Refuse derived fuels may also be traded between regions where one collects and sorts waste and the other has cement plants. This process 7 allows to model these flows.
Exogenous parameters
The parameters Import rate sorted waste (P7_ImportRateSortedWaste) and Export rate sorted waste (P7_ExportRateSortedWaste) represent which waste categories are imported and exported, respectively. The absolute import flow is calculated as a rate applied to the total domestic sorted waste flow. The absolute export flow is calculated as a rate applied to the total domestic sorted waste flow + import.
Model variables
The variables Import sorted plastic waste (P7_ImportRateSortedWaste) and Export sorted plastic waste (P7_ExportRateSortedWaste) represent the absolute import and export flows, respectively of sorted waste calculated from the rates provided as parameters. The next Sorted EOL plastics (F_7_0_SortedEOL) variable represents the flow of domestic sorted waste augmented or reduced by the net imports of sorted waste.
Algebraic formulation
# Sum up all age-cohorts and waste categories to get total domestic sorted waste
SortedEOL_agg = sum[ F_6_7_SortedEOL[c,w]
for all c in age-cohorts and w in waste types ]
# Import
F_0_7_ImportSorted = SortedEOL_agg * P7_ImportRateSortedWaste
# Domestic sorted waste + import
SortedEOL_F_7_8 = sum[ F_6_7_SortedEOL[c] for c in age-cohorts ] +
sum[ F_0_7_ImportSorted[rr,r] for r in regions ]
# Export
F_7_0_ExportSorted = SortedEOL_F_7_8 * P7_ExportRateSortedWaste
# Net domestic flow of sorted waste
F_7_8_SortedEOL = SortedEOL_F_7_8 –
sum[ F_7_0_ExportSorted[r,rr] for rr in regions ]
Process (8) “Recycling”
Short description
Recycling, be it mechanical or chemical, transforms sorted waste fractions into secondary raw materials, with some losses.
Exogenous parameters
The parameter Recycling conversion rates (P8_RecyclingConversionRate) represents the share of each sorted waste type recycled to each type of secondary material. For example, sorted waste for mechanical recycling could be recycled into one type of secondary materials (granulates) with a yield given by the Recycling conversion rate. Sorted waste for pyrolysis, on the other hand, could be transformed into several flows of secondary materials (e.g. pyrolysis oil, gas, and solid residue).
Model variables
The variable Processed EOL plastics (F_8_0_ProcessedEOL) flow encompasses the secondary materials (defined by the user) that can either directly replace primary polymers (granulates from mechanical recycling) and monomers (from solvolysis) or replace fossil feedstock (e.g. pyrolysis oil in a steam cracker). The variable Recycling losses (F_8_0_Losses) encompasses the losses of the recycling process that may not be used elsewhere.
Algebraic formulation
# Recycled flow
F_8_0_ProcessedEOL= F_7_8_SortedEOL * P8_RecyclingConversionRate
# Aggregate sorted waste over all sectors and waste types
Sorted_F_7_8 = sum[ F_7_8_SortedEOL[s,w]
for s in sectors and w in waste types ]
# Aggregate recycled plastics over all secondary materials
Recycled_F_8_0 = sum[ F_8_0_Processed[m] for m in secondary materials ]
# Losses from mass balance
F_8_0_Losses = Sorted_F_7_8 – Recycled_F_8_0